Numbers sometimes distort the facts that lie behind them, says S.Ananthanarayanan.
Numbers have played an important role in the recent Covid-19 reporting. Right at the start, a somewhat sophisticated concept, of exponential growth, became common knowledge.
The concept suggested runaway increase in infections, and growth to millions was predicted. That this did not happen is because of proactive measures, which lowered the rate of transmission and so of growth. Other examples of the numbers, or the math, projecting pictures that are different from reality are of the low level of deaths from Covid-19 in India and the hope held out by the high reliability of the Coronavirus antibody tests.
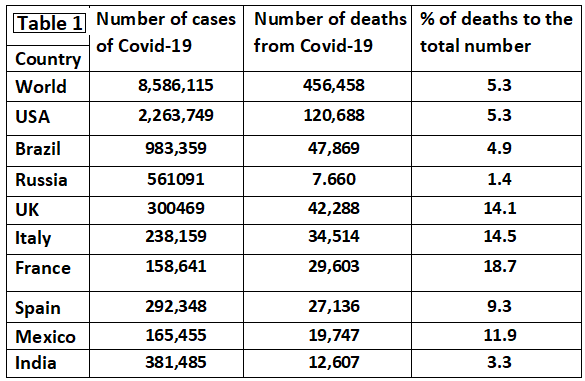
To speak of the first, the low mortality rate, the fatality from Covid-19 in India is assessed at 3.3%, against 5.3% worldwide, 5.3% in the US, a high 14 to 18% in UK, Italy and France, and 9 to 12% in Spain and Mexico, as shown in Table 1. The low figures in India have been viewed with satisfaction, and it has been suggested that Indians have higher immunity, or that the strain of SARS-CoV2 that came to India is less virulent. Analysis of all the numbers, however, paints a slightly different picture.
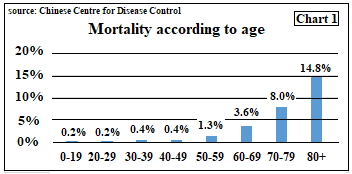
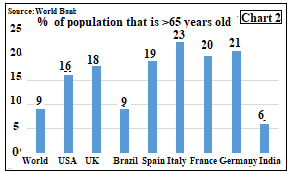
Along with the record of low mortality in India, we need to compare the proportion of population that is over 65 years of age, worldwide, and the mortality risk of those in that age group. Chart 1, which describes mortality risk, shows that the elderly face hugely greater risk than even those in their 40s and 50s. A country that has a larger proportion of older citizens would thus see more deaths that countries with younger population. Chart 2 shows the percentage of persons over the age of 65 in different countries. We can see that the older group in India form just 6%, against as high as 23% in Italy.
These numbers put in perspective the low mortality rate that we see in India. The average mortality among those less than 65 yrs of age, by weights of population, is just 0.25%, and among those older than 65 it could safely be taken as 8%. We can then work out what deaths to expect in a population and hence the overall death rate. The working, for a population of 10,000, is in Table 2.
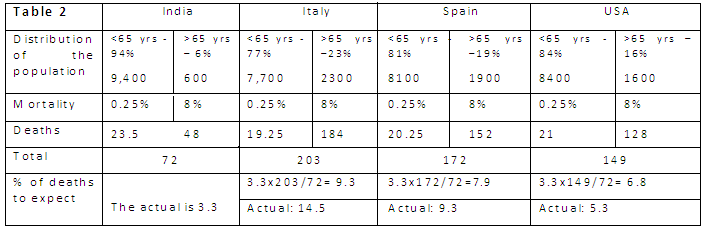
We can see that given the uncertainty of all numbers, the rate in USA and Spain, after adjusting for demographics, are reasonable. It is high in Italy, but Italy was the first affected. France too is exceptional – but we see that figure of 3.3 cannot be taken at face value - our mortality rate is as high as in the rest of the world.
Antibody test
The recommended test to detect Covid-19 is the RT-PCR test. This test is reliable, but it is costly and takes time. For rapid testing, to manage large numbers, another test is the Antibody test, which looks not for the virus, but the reaction of the body to the virus, if it is there. This test is fast and simpler, but it is not 100% accurate. Nevertheless, considerable accuracy, as high as 90 to 99% has been reported and the tests are seen as an aid to quick assessment and relief to burdened treatment facilities.
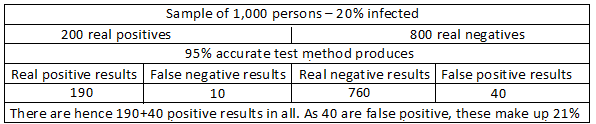
Analysis, however, reveals that even a method that is right 95% of the time in finding a person positive for Covid-19, or otherwise, would not serve the purpose. This can be illustrated with an example of a sample of 1,000 persons, among whom, 20%, or 200 persons are Covid positive, and 800 are negative. Now, our test, which is 95% accurate, of the 200 positive cases, would find 190 to be positive and there would be 10 ‘false negatives’. Among the 800 Covid negative cases, the test would show 760 persons to be negative, but there would be 40 ‘false positives’
The result is that we have 190+40 positive results, but 40, or 21%, are not really positive. And of the 760+10=770 negative results, we have 10 cases that are not really negative.
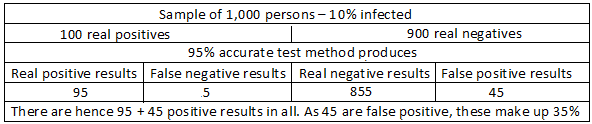
Now let us repeat the exercise with a sample of 1,000, where only 10%, or 100, are positive. Now, of the 100 positive cases, the test detects 95 correctly, and there are 5 false negatives. Of the 900 negative cases, the test would show 855 to be negative, but there would be 45 ‘false positives’. This time the count of positives is 95 + 45 = 130, of which 45, or 35% are ‘false positive’.
We see that the number of false positives has risen from 21% to 35 percent, when the number of positive persons in the sample reduces from 20% to 10%. If the sample had only 5% positives, we can similarly show that percentage of false positives in the positive results rises to 50%.
What these calculations reveal is that a 95% accurate test will throw up an increasing number of false positives when the sample that it is testing has a lower percentage of positive cases. Even in the worst affected areas, the level of infection is still well below 5%. The antibody test would thus produce more false positive results than true positive results. The authorities would then isolate or quarantine increasing numbers that need no treatment. The available facilities would be strained and the false positive cases, hospitalised with real positives, are likely to get infected.
------------------------------------------------------------------------------------------ Do respond to : response@simplescience.in------------------------------------------- 