Statistics and machine learning are the new tools to deal with this scourge of the tropics, says S.Ananthanarayanan.
Statistics and machine learning are the new tools to deal with this scourge of the tropics
The report by Han Sang Park, Matthew T. Rinehart, Katelyn A. Walzer, Jen-Tsan Ashley Chi and Adam Wax, of Duke University, in the journal, PLOS ONE, of a fast and automated method of reliably detecting a major strain of the malaria parasite, is hence of great significance. The method uses optical scanning of the blood sample and computerized, statistical analysis of an assortment of physical features of red blood corpuscles, to estimate the presence of the parasite with reliability that compares well with the present method of manual analysis using a microscope.
Malaria is caused by a group of single celled organisms, in the Plasmodium group of species, which enter the human body through a mosquito bite. The parasites move to the liver, where they reproduce, in a form that then infects red blood corpuscles. Here again, they multiply, till the blood cell bursts, to release parasites to infect other blood cells. Some of the parasites develop into a form that can cause infection in other humans and these enter the body of a female mosquito when she bites an infected person. These grow in the mosquito’s body, and infect other humans, and so on (the male mosquito is inactive, as it does not feed on blood, only on plant nectar).
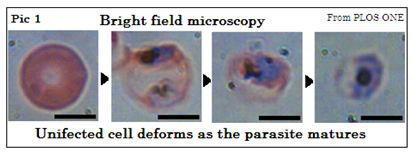
There are four major streams of Plasmodium, of which P. falciparum is the most prevalent and also the most deadly, one of its effects being on the brain, as cerebral malaria. In the standard procedure of examination of the blood sample, a thick smear and a thin smear on a glass slide are stained and then examined under the microscope. The thick smear has a larger sample and an experienced technician can detect even traces of just five parasites per micro-litre of blood. But it is in the thin smear that the images are clearer, and the kind of parasite is more easily identified. It is important to know the kind of parasite present and both samples are generally needed. Pic 1 shows how the appearance changes with infection.
The problem is that the process takes time and there is the need for trained and skilled technicians. There are hence many places where proper diagnosis is not practicable and treatment has to be based on history of fever, as there are no specific symptoms. Treating for malaria by default can leave another, actual ailment untreated and also leads to drug resistance, apart from loss of confidence in the health service.
Automated method
The method developed by the Duke University team is to use a set of twenty three visual/optical characteristics of infected red blood corpuscles by which an automated system could carry out rapid analysis of a sample. The features, such as size, ovality, its action on the path of light, the average and how frequent are deviations from the average of these features, symmetry, distribution of weight, are all found to be affected by infection. No one feature, however, is good enough to be relied upon to the extent necessary. It is not that this approach of analyzing a brace of features has not been tried before, the paper says, but the earlier methods used bright field images after samples were fixed and stained. The more recent method is do without staining but detect structure within transparent cell material by a technique called Quantitative Phase Imaging In this method, part of a beam of light passes through the sample, while the other part takes an alternate route. The path through the cell, just microns thin, is longer to the order of the wavelength of light, which changes the phase of light waves which pass through the cell. This change can be detected and measured with the help of the interference of the two beams when they are brought together. The light beam is split into a widely separated spectrum, to start with, and the cell is analysed in this way in different wavelength ranges.
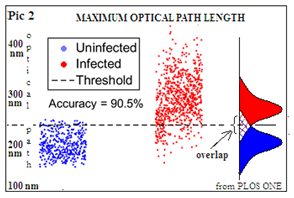
The Duke University team has made use of this method and also processed the mass of data that it produces with automated statistical analysis of the selected features of images of infected cells. Separate studies have shown that each of the twenty three features do indicate the presence of infection, but diagnosis on this basis is not reliable. The value of the maximum optical path length, for instance, the paper says, is an indicator of whether the cell is infected, with 94.0% specificity, 88.8% sensitivity and 90.5% accuracy. We can see in Pic 2 that there is an overlap, which leads to inaccuracy if this feature alone is used to tell the two classes apart. Viewing and measuring the set of increasing numbers of infected cells, by an automated system builds up data of the value of each feature, how closely the values are packed and the way they combine, in the case of infected cells. A machine learning system then uses established statistical methods to analyse large data to device a method of telling the infected and normal populations apart with significantly higher accuracy.
In the normal course, analysis of data is carried out with the help of computers, based on a given formula, or an ‘algorithm’. In machine learning, the system iterates through a succession of algorithms to see which one best fits the data available, and can hence be best relied upon to identify and classify fresh data. As the Duke University paper says, the system “builds a predictive model based on identified inputs as a teaching or learning set and classifies new datasets using a customized algorithm instead of following explicitly programmed instructions.”
The authors of the paper discuss three statistical methods that could be used to enable the system to recognize infected cells. One is Linear Discriminator Classification (LDC), which applies different weightages to the values of identified features, and varies them to see what combination best tells the infected and normal cells apart. Another method is Logistic Regression (LR), which is related to LDC but with different assumptions. And a third method is the Nearest Neighbour Classification (NNC), which is a method that tries to maximize a measure of similarity
The process could hence be used for quick and accurate detection of the stages of infection by P.falciparum, with a suitable device and minimal operator training, the paper says. “This would permit rapid analysis of a blood sample at the point of care to assist the clinical decision of physicians,” the paper says. This would be a crucial step for treatment and control of malaria in resource-limited areas where infection rates are the highest, a press release from Duke University says.
------------------------------------------------------------------------------------------
Do respond to : response@simplescience.in
